
Congrid Live Service - Company safety statistics
Open the "Admin" drop-down menu and select your company.

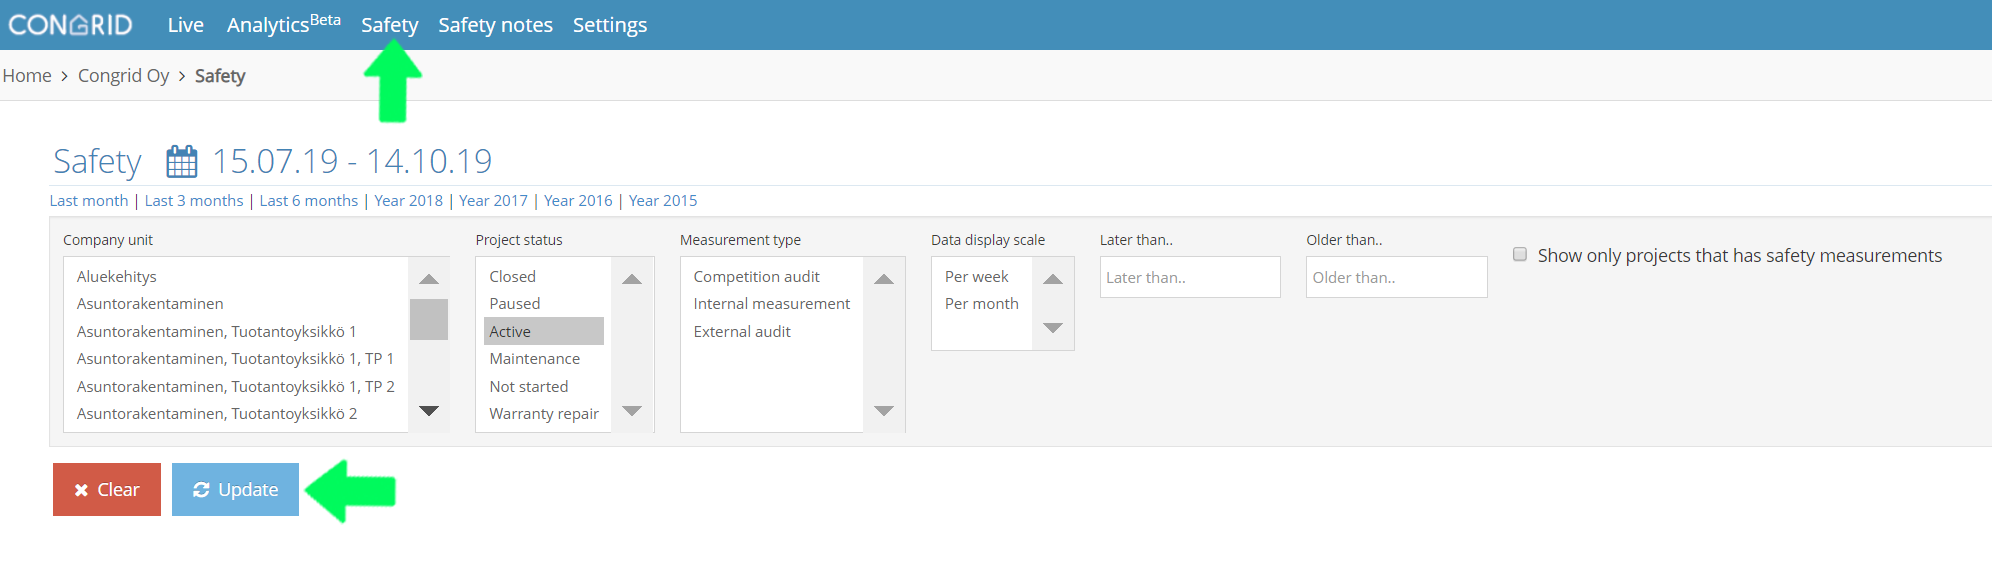
1. Select "Safety".
2. Filter safety measurement results by:
Project Type - Projects that are active are selected as standard
Measurement Type - Internal measurements/External audit/Competition audit
Date - per week/per month
Measurement Dates - Choose a measurement before or after a chosen date
When you have chosen criteria, click "Update".
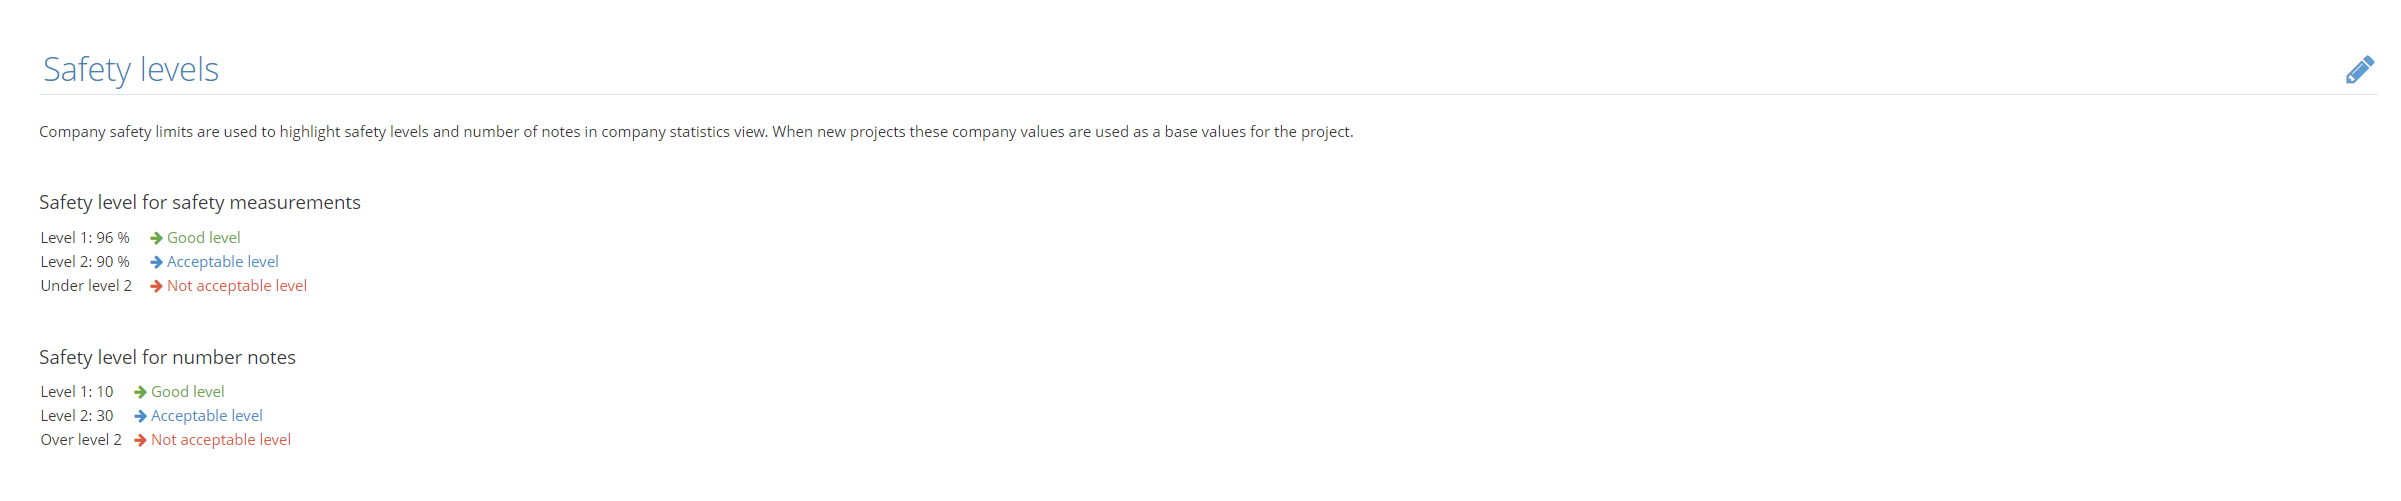
Company safety limits are used to highlight safety levels and a number of notes in the company statistics view. When new projects are started these values are used as base values for the project. The background colours for analytic statistics displayed below are based on company limits that the company has set. These limits can be changed for a company.
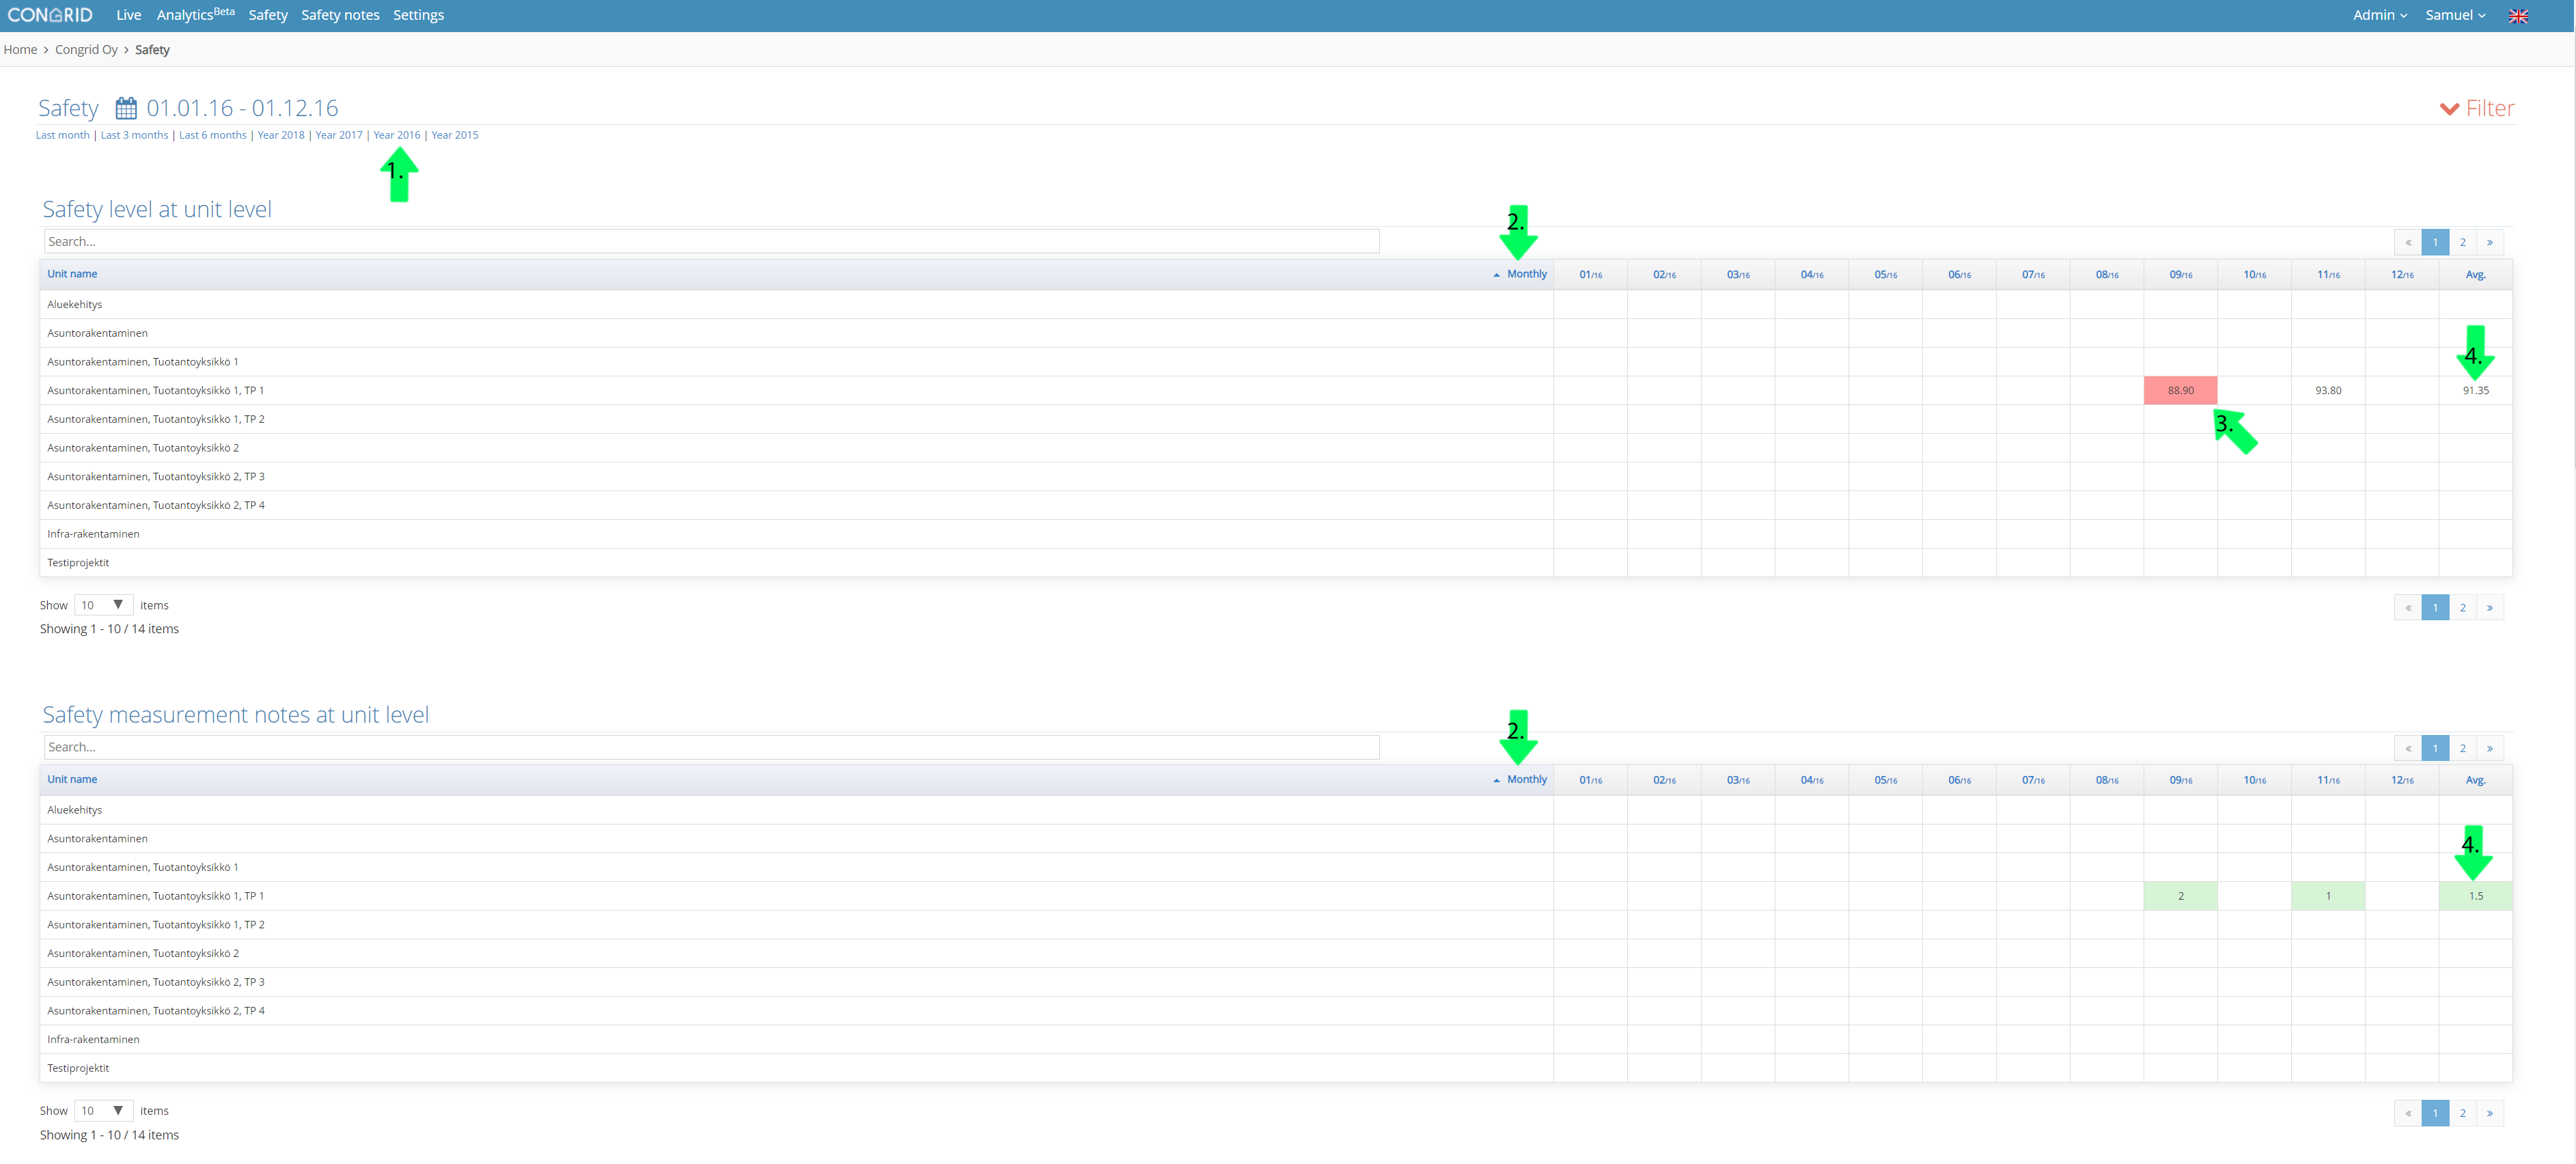
Safety level and safety measurement notes at the unit level
All figures including average values are created from company project measurements and notes.
1. Choose a time frame you want to inspect.
2. When a time frame has been filtered by month, safety measurement statistics are displayed by selected month.
3. When measurement level is at an unacceptable level they are displayed as red.
4. Measurement average for all time frames is displayed in the last column.
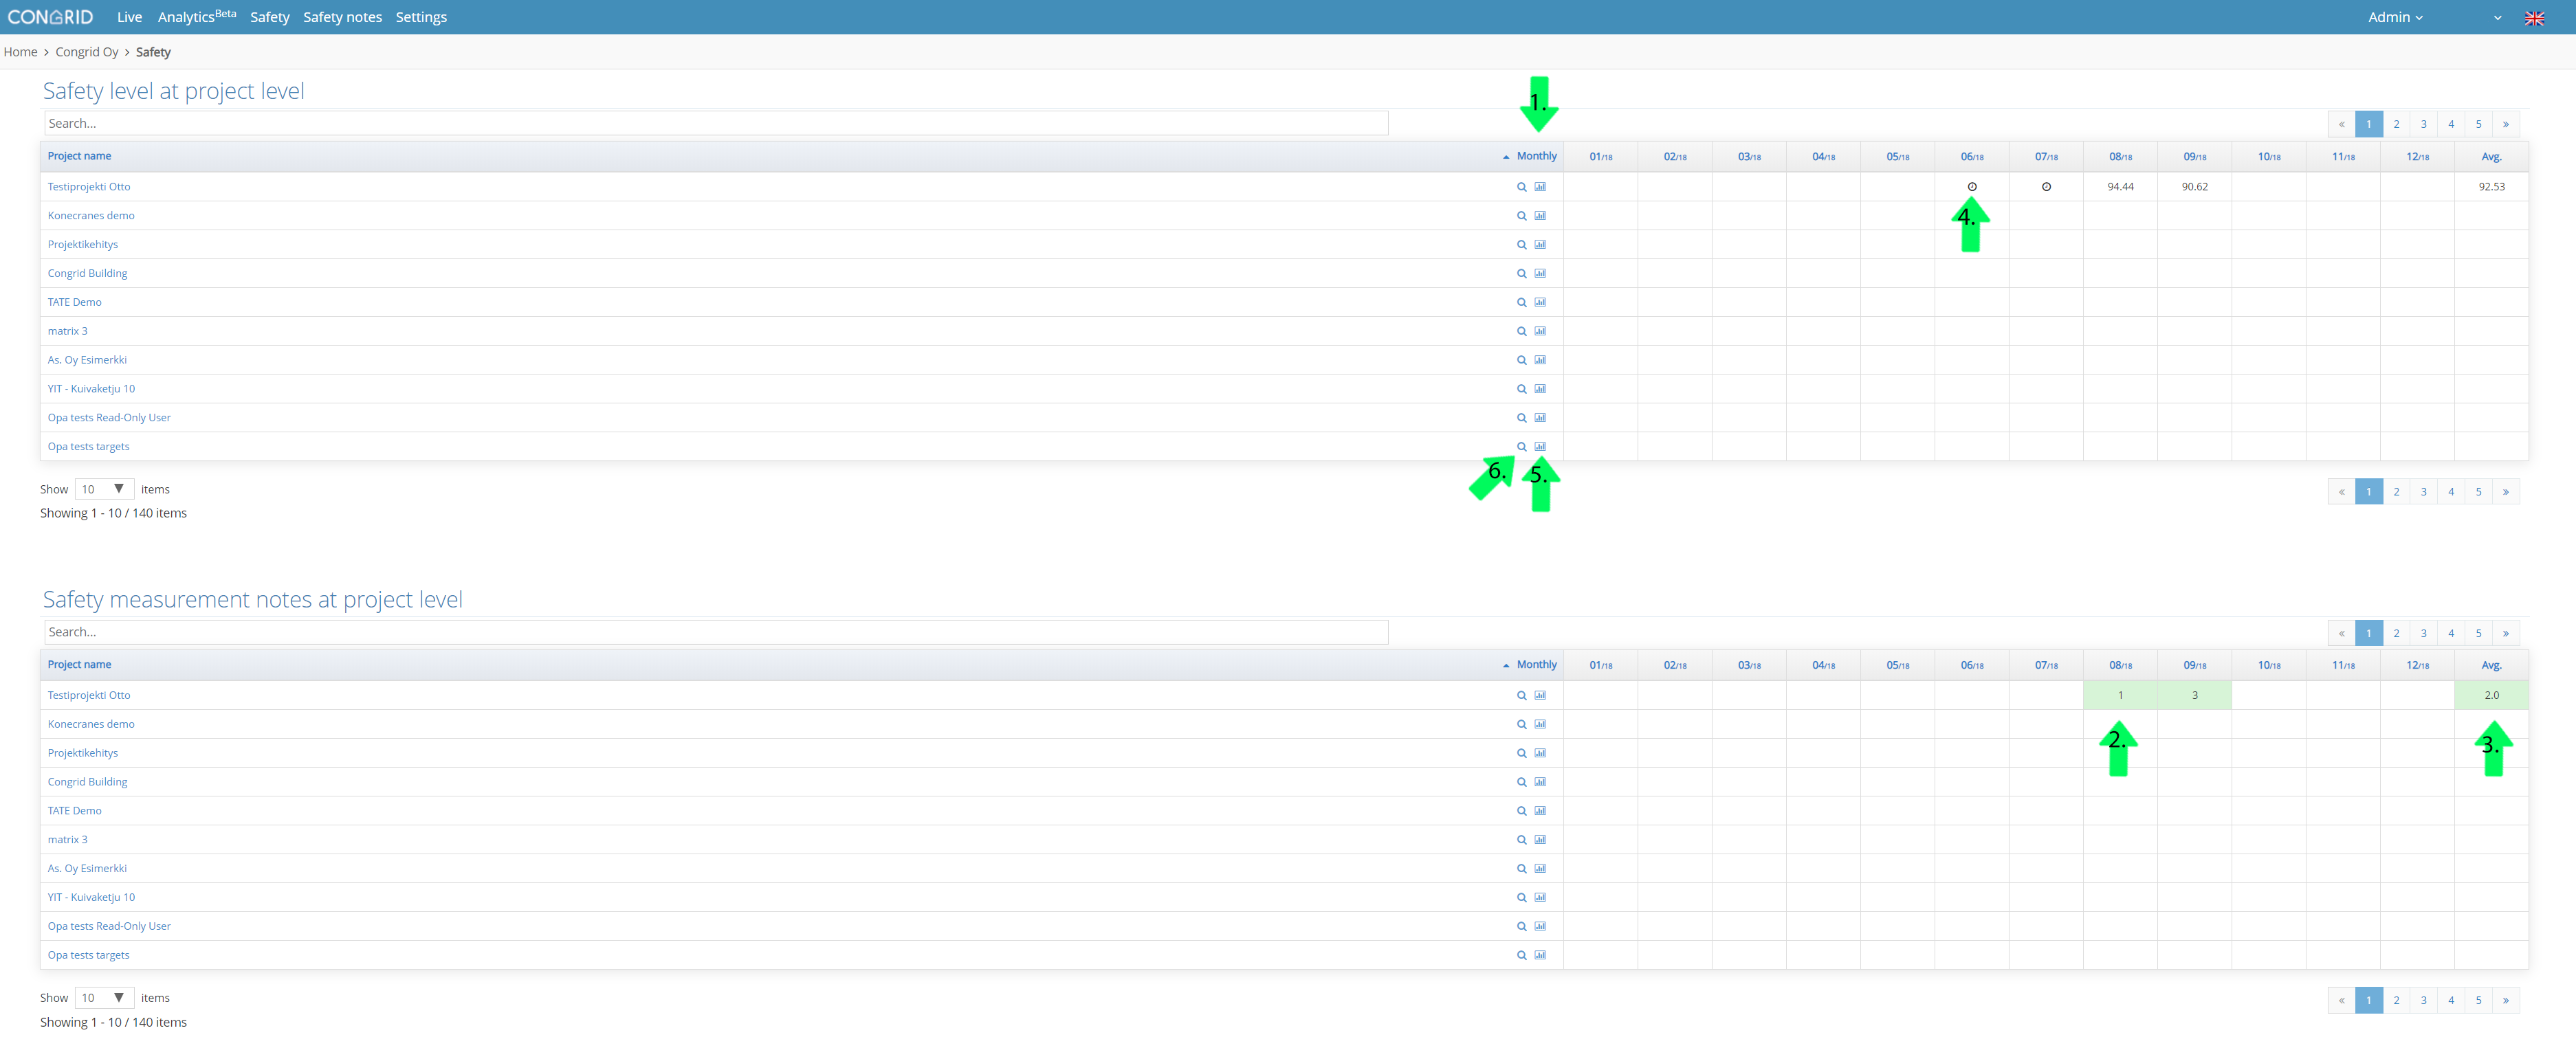
Safety level and safety measurement notes at project level (All company projects)
1. When a time frame has been filtered by month, safety measurement statistics are displayed by selected month.
2. If multiple measurements have been done in a single columns time frame the number visible is an average of all measurements.
3. Measurement average for all time frames is displayed in the last column.
4. If all measurements in a column are in "incomplete" status are they shown in the statistics with a clock -icon.
5. Project safety measurements -the page is opened from the spot displayed by the arrow.
6. Inspect more precise project safety analytics
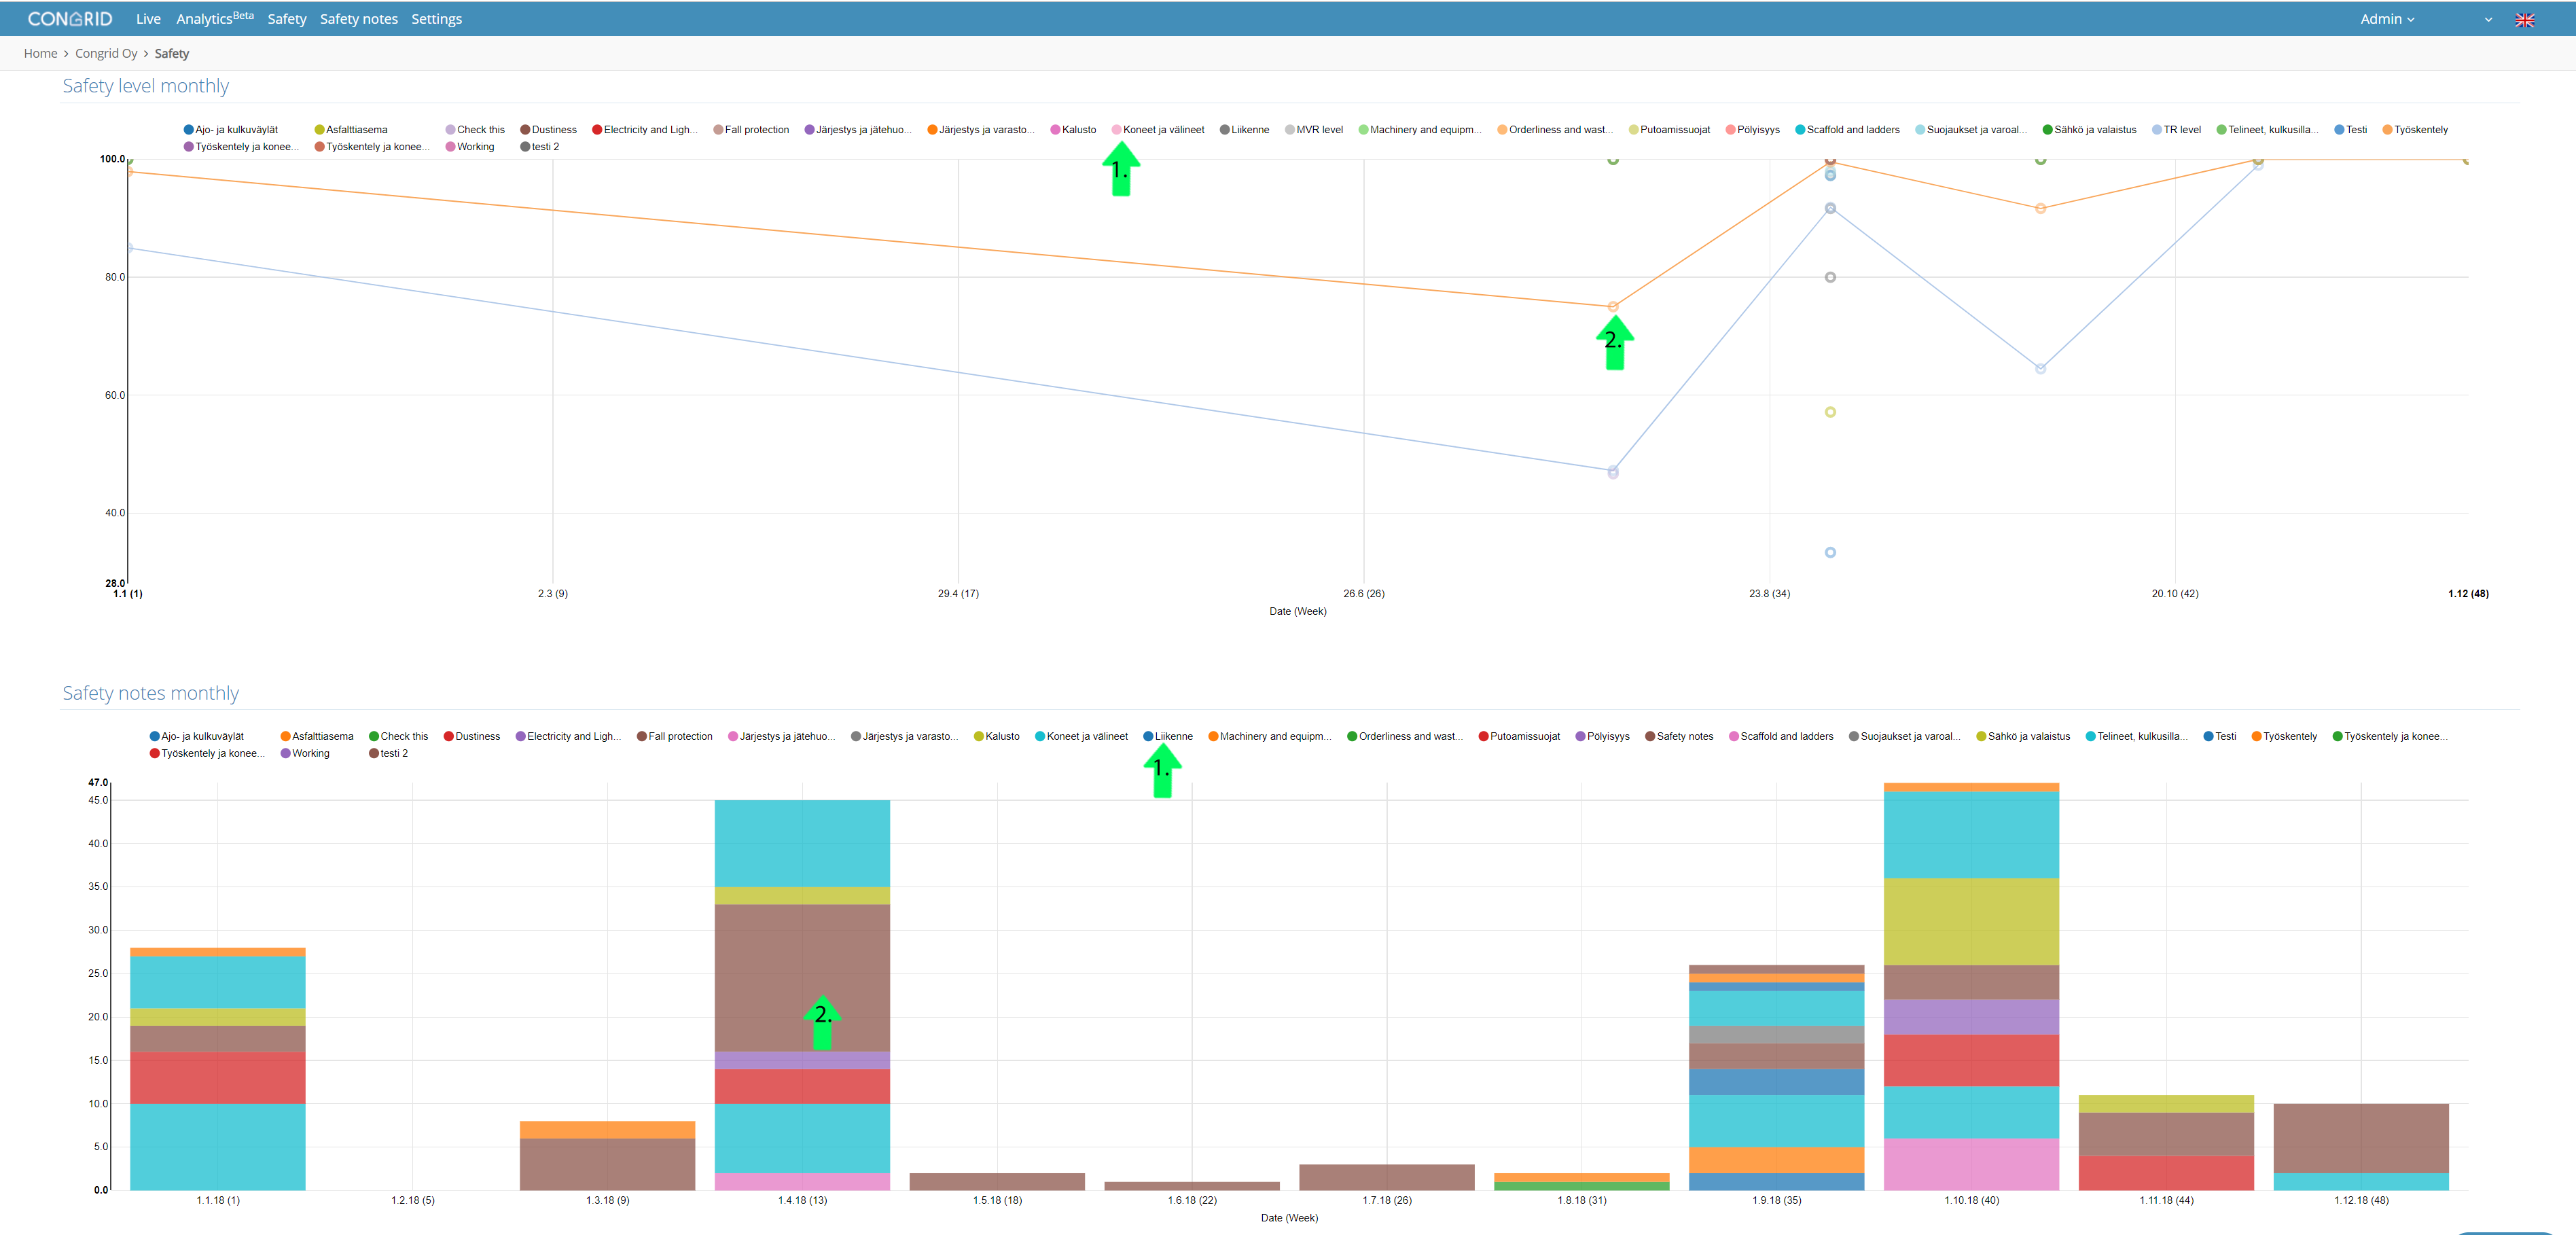
Statistics graphs
1. By clicking any colour code, it is filtered out of the view. By double-clicking only, its name is left in the graph.
2. By dragging your cursor over any colour in the graph, the amount of notes with the name is shown according to filtering. By month or week.
If project type is set as a test project, the project's data will not affect company level analytics. (See the guide on project settings: Basic project data
Comments
0 comments
Please sign in to leave a comment.